

Food takes 12.9% of household expenses, large increase in fruit and vegetable spending
Food makes up 12.9% of average U.S. household expenses as prices rise for categories including beef and fresh fruits and vegetables.


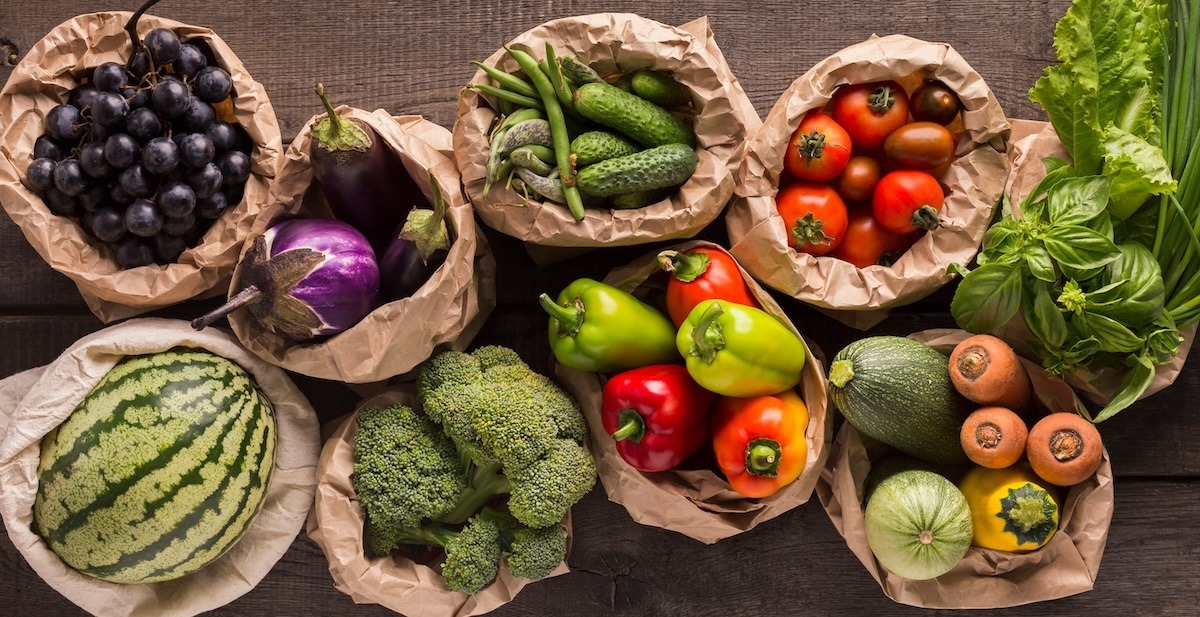
Food accounted for 12.9% of average U.S. household expenses, making it the third-largest expense category behind housing and transportation, according to an analysis of federal consumer spending data.
CashNetUSA analyzed the U.S. Bureau of Labor Statistics’ 2024 Consumer Expenditure Survey to examine household food spending and differences among generations. Housing represented 33.4% of average household expenses, while transportation accounted for 17%.

The findings come as food prices continue to rise. U.S. Department of Agriculture data cited in the study showed food prices increased 3.2% between April 2025 and April 2026. Some food categories recorded substantially larger increases, including wholesale beef at 14% and fresh fruits and vegetables at 11%.
Prices for eggs, dairy products and fats and oils, however, were expected to continue declining in 2026.
The analysis also identified differences in how generations allocate their food budgets. Gen Z households spent 41.5% of their annual food budgets on food away from home, the largest share among the generations studied.
Americans also spent an average of $719 annually on snacks. Chips represented $214 of that spending, the largest share of the snack budget.
For beverages, Silent Generation households allocated 23.5% of their nonalcoholic beverage spending to coffee, the highest share among the generations.
CashNetUSA calculated spending percentages using BLS household expenditure data and segmented the results by the generation of each household’s reference person, generally the person who owns or rents the home. The analysis covered the five most recent generations, with data reported as current through May 2026.
Industry News